Welcome data initiate! Excited by the prospect of spending countless hours down on your knees cleaning spreadsheets and telling jokes about statistical variables that leave you confidently single? Well then I hate to be anti-climatic, but death by data isn’t really our thing, though maybe this guy can help..

However, we can give you the next best thing, one that we prefer. How about the quick and dirty 1–2–3’s to help your team use data quickly and efficiently?

I mean don’t you want to make it easy for every Jim, Sarah and Nazeem in your company to find insights in a way that’s fun and groovy, instead of always relying on the evil data sorcerer that sits in the nether reaches of the office? Behold, Datadeck’s quick and dirty intro to using data, made for dum dums by dum dums!
Let’s first get some misconceptions out of the way with some affirmatives.
1.Data is freaking sexy
(Check out the curves on that.. parabola..)

They say that data analysis is the sexiest job of the 21st century and 64% of data scientists agree with it wholeheartedly. I mean, just check out our other post about using data to get more hot dates!
Even more, Datadeck is out to give data a hip new makeover. In fact our secret desire is to replace “Friday night netflix and chill” with “Saturday night bar charts in my PJs” ? ?.
So get the image of a data nerd with his pokemon cards out of your system. Because those living the real data-driven lifestyle prefer Pokemon Go!
2.Youz already knowz Big data!

Nothing to learn here. Big data was just a way the Kardashians of the data industry wanted to sound fashionable and jingly. All it really means is, you guessed it, big, data.. The large corporations out there harped on the term, attaching it to every shiny server, cloud or software they wanted to sell. You now know as much about Big Data as you ever could, give yourself a pat on the back!
3. Data Scientist isn’t the hottest data job. Yours is!

That’s right, it might have been previously that data was only accessible to the initiated but with new and easier tools, it’s becoming easy for everyone from the CEO to the beer pong guy to look at data and gain insights. The idea that you need to beg some guy in a black box like you’re in a confessional to get your analysis or reports is over. EVERYONE on your team should be data wizards and have a blast doing it!
Now Some Real Tips For the Dum Dums

So are you feeling sexy and stoked to start killing it with data on your team? Then I guess you’re ready to take the short cut! Let’s jump to the essentials that will let your whole team use data effectively without having to suffer all the downtime and pain of your forefathers.
- Choose goals and metrics

This first part isn’t really a shortcut but an obvious prerequisite. Choose the goals your team wants to improve. Is it more sales, leads or customer satisfaction? Once you’ve done that, select the metrics that if improved, would directly improve the performance of your goals.
For example, if you’re trying to improve lead generation, important metrics might be things like conversion rates on your website or click through rates for your Ads. You’re basically going to want to track them alongside your goals.
2. Report on them meaningfully

Next, decide which angles you’re interested in looking at your metrics and goals from. For example, do you want to look at conversion rates by different geographies, products or devices? This helps you see if perhaps conversions are weak for a certain device, so you can focus on improving the way you engage people on that device.
But if you’re using analytics tools and looking at the standard reports that come with them, chances are, the data isn’t shown in the exact way you want. For example your tool may only give you click through rate data for each campaign, but maybe you want to see it instead for each keyword.
Or maybe you want to compare the same data side by side over different periods. Luckily tools like Datadeck can connect with the original data you’re looking at and let you pick and choose how you want to view them.
3. Make reports easy to understand

Nobody wants to look at a bunch of numbers all day. If you put all the metrics you chose above into a spreadsheet, both you and your team members are going to quickly give up with glazed eyes from row and column overload. Instead, show the data using eye popping visual charts that help tell a story with your data.
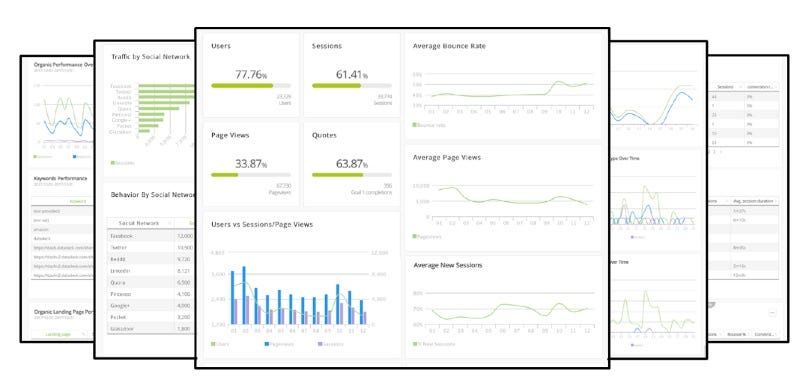
These will make it easier for your eyes to notice special circumstances in your data and act on them. You can easily visualize your data by connecting them to Datadeck and building charts from them.
4. Get rid of the manual work

Visualizing your data in a nice report that shows everything you want is nice. But having to do it over and over again is going to kill the team. If you try building your reports in an Excel file, not only is it going to take a lot of time on the first attempt, you’ll have to repeat the process again the next day or week when new data comes in. Instead, use a tool that not only lets you build reports quickly, but continues to pull new data into your reports whenever there’s new data. You can easily do so by automating your reports with Datadeck.
5. Gain freedom from IT
Ever worked at those companies where whenever you wanted to get a report you’d have to go up to IT, explain what stats you’re interested in and then wait 3 hours for them to build it? Or perhaps you worked somewhere where all of the data people wanted to use was spread all over the place. Some of it was in different analytics tools, while others were owned by other departments or people, making it a pain in the neck for whoever wanted to build reports from those sources.
Like we mentioned previously, Data is now meant for EVERYONE. With new centralization and self-service tools like Datadeck, anybody in the company can bypass all of this nonsense and literally in moments, self build reports from whatever piece of data they wanted.
So go for it and start pimping on your data!

That wasn’t so bad, was it? From one dum dum to another, believe it or not, these tips are really all you need to hit the ground running. Not only that, you can literally do all of the above with just one tool. Datadeck! Get your team on it right now. Connect your different data sources to Datadeck. Then bam! Anybody in the company can build reports that visualize the data however they want, in minutes! Do it now, it’s free!