
Let me tell you a story about an HR manager named Larry.

When you’re an HR manager named Larry, you manually build HR reports in Excel each week.

And when you manually build HR reports in Excel each week, you waste hours of your life. When you waste hours of your life, you feel guilty. When you feel guilty, you visit a hypnotist. When you visit a hypnotist, you wake up at a voodoo shroom party. When you wake up at a voodoo shroom party, everyone thinks they’re a peacock. When everyone thinks they’re a peacock, the feds kick down the door.
And when the feds kick down the door, you end up on the run with a man who calls himself the Mad Hatter.

The moral of the story? Don’t end up on the run with a man who calls himself the Mad Hatter. Stop losing hours of your life each week building and re-building HR reports. Check out how to speed up the process in this article.
Larry’s Excel Problem
First, let’s look more into Larry’s dilemma by observing his reporting process. Every time a new candidate came up to interview for Larry’s company, the hiring manager overseeing that position would input a new row for that candidate into a shared spreadsheet and overtime, input additional data regarding the progress of hiring for that candidate.
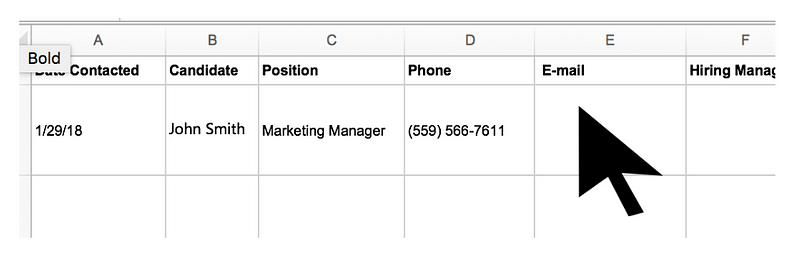
Pertinent Information for each candidate would be:
- The name of the position and the department
- The responsible hiring manager
- The dates of the initial contact, the first interview and the 2nd interview
- The results of each round, whether or not an offer was given and whether or not it was accepted.
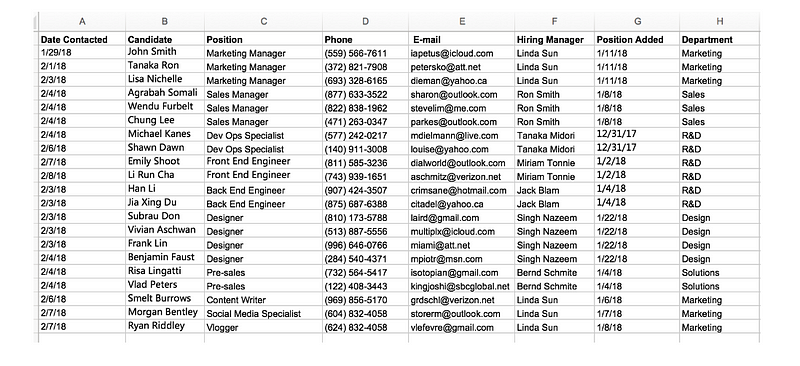
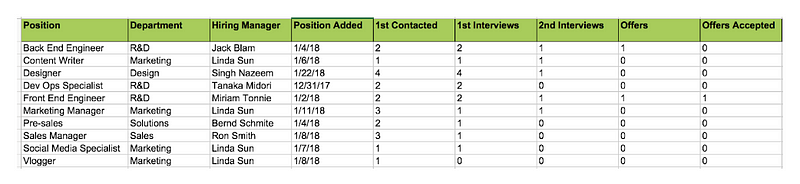
Example Spreadsheet (columns A — H)
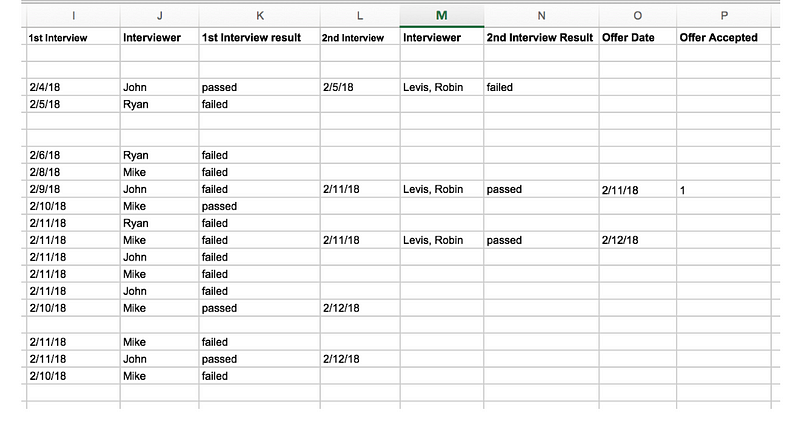
Example Spreadsheet Continued (columns I — P)
Every Monday, Larry would then take information from that spreadsheet and create another spreadsheet report that summarized the weekly progress of hiring for each position so his team could detect any slowdown or issues in the hiring process.
For each position, the report would include how many candidates were contacted, how many were given a 1st round interview, how many were given 2nd round interviews, how many were given offers and how many accepted offers. Also attached to each position would be other information such as who the hiring manager was, when the position was first opened and what department it belonged to.
Example summary report
Now Larry’s company was a fast-growing startup and they were aiming to fill at least another 30 positions within a few months, many of them developers. Depending on the number of candidates, a report like this could take between half an hour to over a few hours to make each time.
This was because to get the stats for each open position in his report, he would have to find the row for every candidate that interviewed for the position and add up the number of initial contacts, first time interviews, 2nd time interviews, given offers and accepted offers.
In addition,he would have to tack on the other information for that position as listed above. The manual nature of the report meant that errors often occurred and had to be fixed later. As if that wasn’t bad enough, Larry would have to go through this all over again the next week.
The Solution, Datadeck.
What Larry needed was a tool that could cut through the manual finding and adding and even better, update the reports automatically without him having to do it again. Datadeck could make this possible. After uploading the original shared spreadsheet (the hiring managers were updating) to Datadeck, he could literally build a table that showed the pertinent stats for each job position in under a minute.
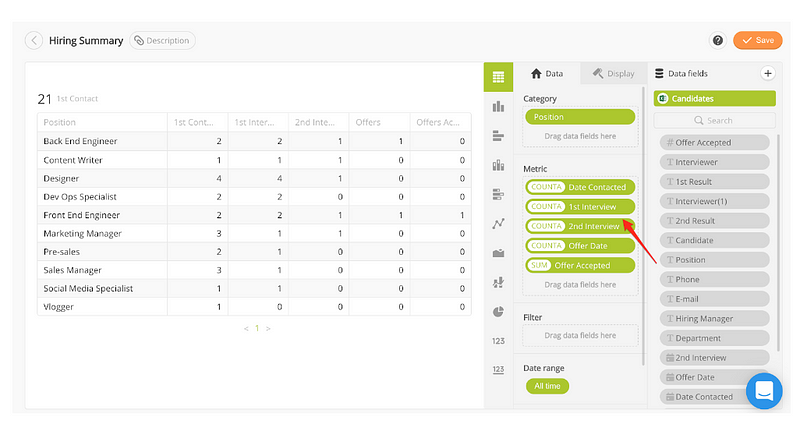
All of the column headers in the spreadsheet were available as selectable data points in Datadeck’s chart builder upon uploading the spreadsheet. All he had to do to create a row for each position on a table was drag the job position header into the category section of the chart builder.
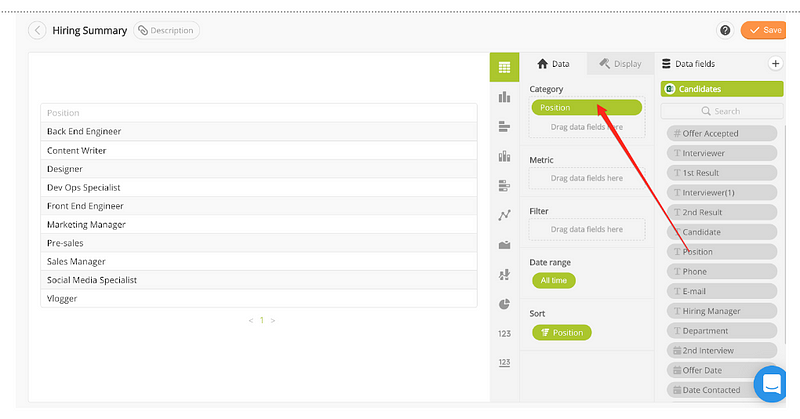
He could then easily drag the column headers: 1st contact, 1st interview, 2nd interview, offers given and offers accepted into the metric section of the chart builder and miraculously, the respective stats for each column would show up for each job position.
The same is true for the other pieces of information for each position.
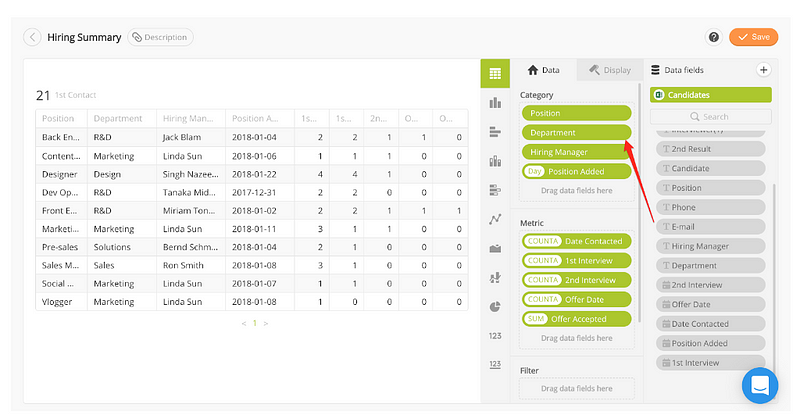
Pretty much the entire manual process could be shortened to less than 10 clicks. Even better, he would never have to do this again. He could either upload the updated spreadsheet file the following week or even better, have his team edit a Google Sheet that was connected to Datadeck. This would automatically populate his report with the latest data and make it ready for browsing the next week.

Are you ready to reduce your HR reporting time and focus more on getting high quality hires and improving the number of pizzas consumed per team member in the coming year? Then start using Datadeck to automate your HR reports and don’t end up on the run with a man who calls himself the Mad Hatter.