I’ve often thought to myself, “What made Excel / Google Sheets / CSV such a popular mode of keeping files, documents and recording data?” – These three different platforms doing roughly the same thing.
The answer lies in how our data habits evolved. I was born in the 80s, when computers weren’t everywhere and were a relatively expensive commodity; which meant filing records/data was done in ledgers, folders and files, which had the distinct advantage of being inexpensive and requiring little skill and know how. With the advent of computing systems and automation, programmers were faced with the tricky task of providing accounting and data recording software which exhibited this same trait.
So, A Brief Rundown of the Most Important Events in Spreadsheet History
CSV
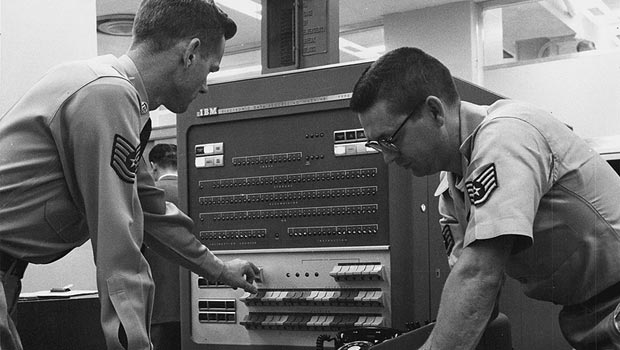
CSV or Comma Separated Values, debuted in 1972 and formally got its name in 1983 and soon enough most big companies and enterprises were using it. It was adapted in myriad ways from staff punching cards, to hotels reservation systems, to airport management systems, to accounting and more but it was still out of the reach of regular folks. CSV files are used for the interchange of database information between machines of two different architectures, and the files are readable as well, so it’s easier to use them in the absence of proper documents.

Microsoft’s Excel
With ease of use and data recording at heart Microsoft’s Excel, it debuted in 1985 and from there began a journey of transferring data from physical paperback records to microchips, but since no other way existed, all data entry was done physically. Ouch.

With the Internet revolution many things changed but what didn’t change was data. The use of CSV and Excel required maintaining databases and careful storage, and there quickly came 2 important realizations:
- Data from any application must be standardized so as to make importing and exporting easier and…
- Data should be accessible from anywhere, through the internet.
Google Sheets

This need to access data from anywhere kicked off the cloud computing industry, with Google Drive and Google sheets being released in 2006. Anyone with access to the internet could now access and edit their data from any part of the world and this changed things. It was the rise of the SaaS industry.
One Drive

Formerly SkyDrive, Windows Live SkyDrive, and Windows Live Folders, this application enabled users of Excel sheets to upload their data into One Drive and edit it anywhere.
Proliferation
E-commerce and the mobility of data birthed an array of applications, and digital marketing became mainstream and gained popularity and led to data tracking, web traffic monitoring, and studying and understanding user behavior and interactions with websites and applications.
As digital marketing grew and ad spending ballooned, there came the need for better data analysis, data visualizations, and data driven insights which could aid real actions. This required data from different applications to be assembled properly, and Big Data became a new buzz word and data/web analysis by tools such as Google analytics, Ptengine, etc and data visualization tools such as Tableau, Datadeck, etc, became a boon to digital marketers.
As new web marketing tools crammed up for solutions, the market got more distributed and fragmented with each tool offering a unique feature and users ending up using multiple products and software. But there were many applications out there that couldn’t be integrated into data visualization tools and the audience using them was huge…
Centralizing Data
So, digital marketers were stuck viewing data from multiple applications, which created the new challenge for data visualizations tools. By utilizing applications’ APIs (Application Programming Interfaces) one could allowed the Data visualization tools to show data from different Applications. This was a herculean task for any individual tool to take one, and which APIs would be connected to by a certain tool would depend on prioritizing by user popularity. This led to users of barely used apps feeling let down.
This was when developers of marketing tools came up with the solution to export CSVs (although not entirely for this purpose but to make export of contact information for the purpose of unsubscribing easier).
This opened up a world of opportunities and possibilities. This meant that no matter what data source you have, you could extract data from your application into a Google sheet – the equivalent of a CSV export.

This meant that all data sources which hadn’t been integrated by data visualization tools, could now be connected to the tool using a third party application, even though this wasn’t the best solution, it was “a solution”.
So these are the main events up to this point. As spreadsheets continue to evolve, and become less clunky, we hope to spend more time working with the data they hold and less time staring at those pesky rectangles. Check out Datadeck if you want a nice buffer between you and your spreadsheets: www.datadeck.com