With the wealth of data companies are generating these days, the ability to structure and re-contextualise data is becoming more and more important. Adwords Managers and Facebook Ads Managers can deal with heaps of data, and not just from their campaigns. They have to see the effect their campaigns are having on landing pages, as well as keeping track of keyword rankings, social media presence and a host of other metrics.
So, in the spirit of good data-housekeeping, here are our Top 5 Reasons why PPC Managers need a (proper) data viz tool!
1. Constant monitoring
The real key to PPC success is persistence. There is a constant workload of monitoring your add success, adjusting text and creatives, and running experiments. The Adwords interface itself isn’t necessarily the best place to do this. It can be a complex application at times, requiring many clicks to see what it is you want to see. There aren’t many options for tailoring the interface itself, so a data visualization tool can be better at providing quick updates.
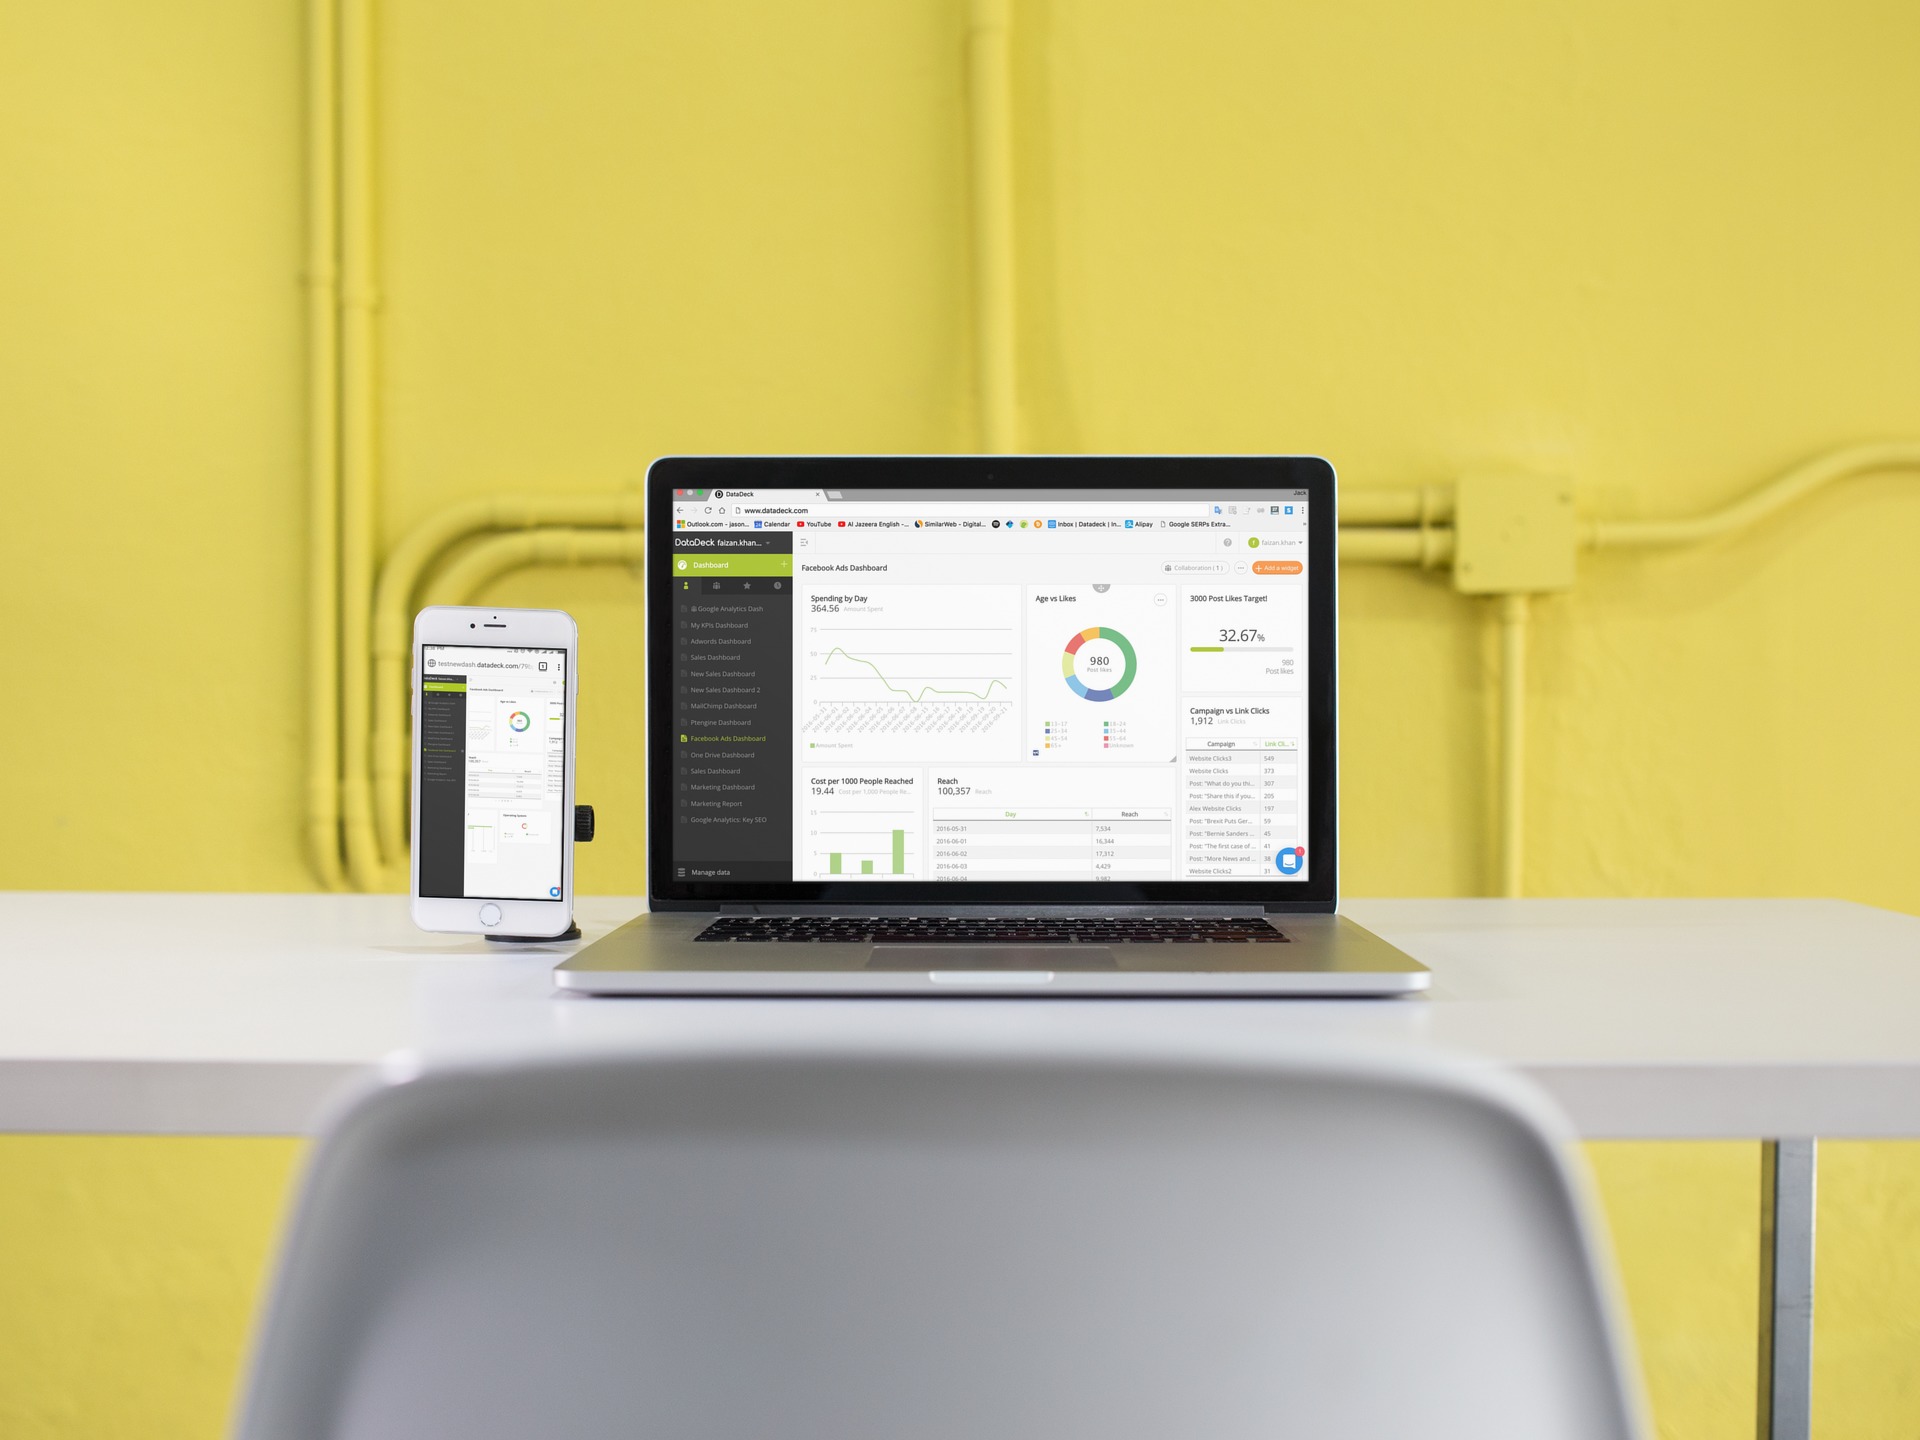
Many Data visualization tools will allow you to create dashboards filled with the exact information that is relevant to you. You can then see everything you need with a single click, and even access your data on the go from your mobile device, or throw it up on a screen in your office.
2. Landing Pages vs Ad Success
One of the things you will want to do as an Adwords or Facebook Ads Manager is have input on the landing pages your ads point towards. By building up dashboards that place the analytics info for these pages alongside your ad campaign data, you can mace connections between the ads and what the visitors to these pages are doing.
Data viz tools like Datadeck can even blend Google Analytics data with data from other sources, such as Adwords or Facebook Ads, displaying the data within one chart or widget. This is useful for when it comes time to prove to your boss or clients that you have been successful. (See number 5)
3. Pooling Your Data
Having all business data in one place is becoming more common these days. One of the worst aspects of the tech boom is constantly logging in and out of websites, apps, and devices. By bringing your data together in a specific data visualization tool you can make your life simpler and benefit from the added aesthetics and customization that the tool has to offer. It can also make sharing easier, which leads us on to…
4. Simplifying monitoring for Colleagues
Another major benefit to using data visualization tools is they help with the “democratization of data”. Traditionally companies have had analytics specialists who write monthly reports which few people read. These days, many companies are encouraging their employees to engage more with data and make more data driven decisions.
This can be tough if your employees/colleagues aren’t familiar with ever specific app or tool you might be using. An ergonomic data viz tool can put everyone on a level playing field. The best ones are easy to learn, and facilitate the sharing of data, often allowing for dashboards to be pinged across to people via link, even if they aren’t signed up to the tool.
Having company-wide data dashboards with the ability to grant or restrict access to certain individuals is the way things will work in the future. No more forgotten reports.
5. Report Building
And last but not least – report building! One of the most amateurish things a company can do is produce lousy reports, either internally or externally. Good data visualization tools can make PPC campaign report building easy. Dashboards like the ones at Datadeck will update automatically, so sharing a report can be as simple as annotating the dashboard with text boxes and pinging it to your client.
Dashboards can impress more than spreadsheets or word docs, especially when used in meetings or over the web. No Adwords Manager should ever have to spend time having to take screenshots of graphs and tables in Google Analytics for monthly reports. Just link up a good dashboard tool and let it update automatically.
So there we have it – our Top 5 Reasons to get onto a good data visualization platform. You can check out Datadeck here if you want all of the above, or you can check out a list of other great data dashboards here.
Let us know how you visualize your data!