Being a data analyst has become much easier in the last couple of years with all the amazing software applications that have come out to help and support data analytics. Drag ‘n drop metrics and setting up reports but also finding important insights to improve your companies sales or help being more efficient with the companies marketing budget.
The role of the data analyst not even to mention the data scientist is more important than ever!
In this article we will look at the differences between correlations and causality between data sets. Also I will show you some hilarious correlations between data found by Tyler Vigen.
What is Correlation in Data analytics?
A simplified definition of a data correlation is when two metrics are strongly linked to each other and follow up on each other in a linear line.
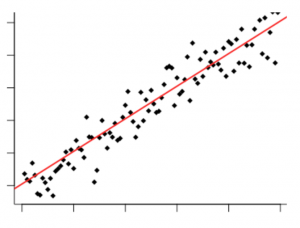
A correlation can be positive or negative.
When a correlation is positive there is an increase of value.
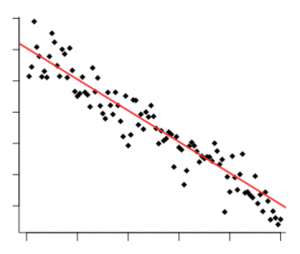
If the the correlation is negative it will show a decrease of value:
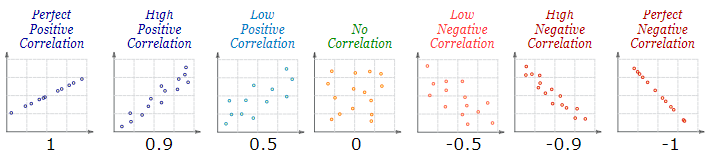
When the variables show minimum difference and the line that goes through all the dots in the chart has almost no difference we are talking about a very strong correlation. The highest correlation number is 1.0 which means all dots are aligned perfectly.
Let’s use a sample with this. I own a bicycle shop and I want to see if there is a correlation between temperature during the months and my sales amount.
| Bicycle sales vs. Temperature | |
| Temperature °C | Amount of bicycles sold |
| 13.2° | 22 |
| 15.8° | 33 |
| 12.1° | 19 |
| 14.9° | 33 |
| 18.8° | 41 |
| 22.3° | 52 |
| 19.9° | 41 |
| 24.9° | 61 |
| 22.9° | 54 |
| 18.3° | 42 |
| 23.1° | 45 |
| 18.0° | 41 |
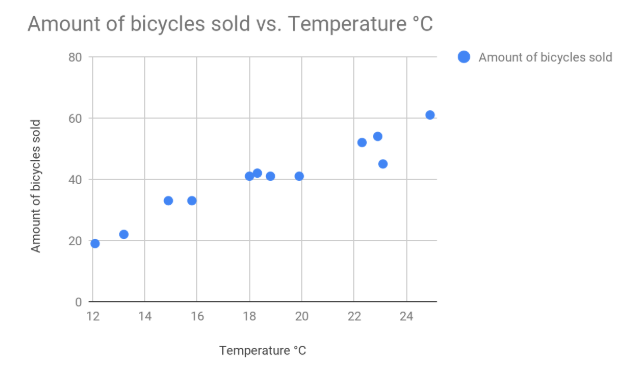
You can already see that there is pretty strong correlation here. In fact the correlation is : 0.95775.
Learn how to calculate your correlation with this correlation calculator.
What is causality in Data analytics?
If you want to figure out what is causing for example a peak in your sales there could be a lot of factors. But it also means that some correlations are not proven to cause affecting others.
Some basic causation rules:
- One thing could cause another
- The other might cause the first
- Or maybe they are connected through something else
- And finally… it could just be a “stupid” chance.
In a lot of cases our mind likes it to find correlations that are actually not there. There are tons of samples on the internet where correlations are 100% clear, but simply don’t make any sense.
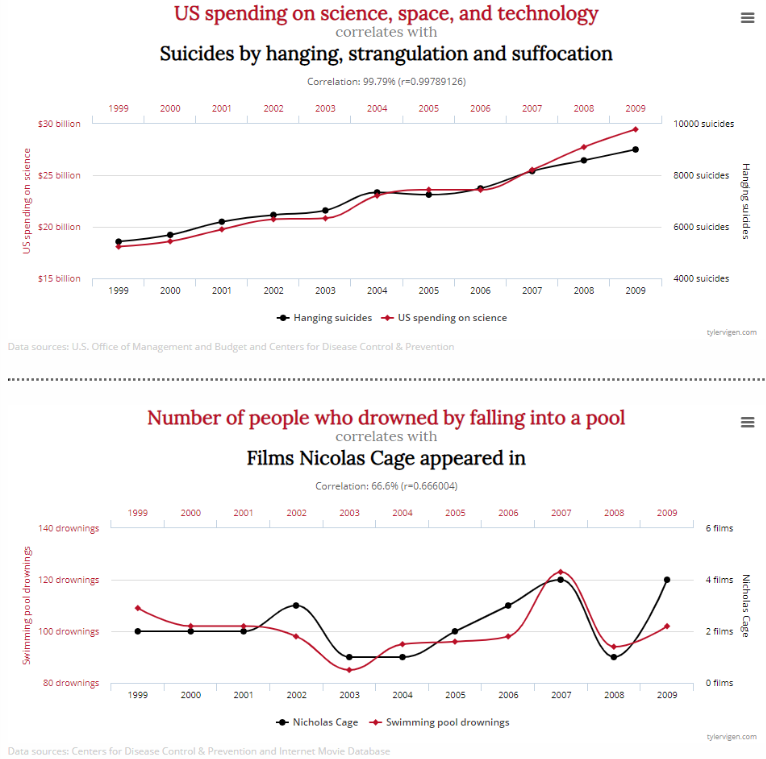
Tyler Vigen is famous for his book on Spurious Correlations where he analyzed tons of metrics and found some hilarious “correlations” between them.
When you look at these, you can see that both have strong correlations but just (I hope 😉 ) coincidental.
Summary
The main takeaways from this article where we explain the difference between data correlation and causality:
- Dig deep analyzing and finding “real” correlations
- Not all correlations are strong enough to make decisions on, make sure to calculate the correlation coefficient.
- Use common sense in a lot of cases to exclude causality
- Make use of easy to use data visualization software to help you blend data and find quality correlations quickly. Give Datadeck a try 😉