Sometimes I wonder why everybody uses Excel?
The answer is simple — it’s a great app for collecting your data and doing calculations. Though these days, Excel seems to be getting more complex with every release.
I love Excel but hate their charts
I’ve switched to Google Spreadsheets and another app (skip past BTW to find out what app). It’s a great free alternative, with the same features of Excel and the added benefit of being right there in my Google Drive whenever I want it!
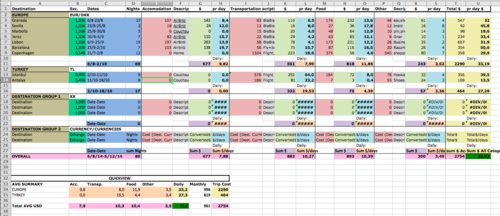
Every company collects data using spreadsheets. No department escapes their net! But making reports on a daily, weekly or monthly basis can be kind of boring. And it takes a lot of time!
What if you could automate that hard stuff!? Excel does have some very advanced report features with charts that update automatically. That is, assuming you’re an Excel guru and can take care of that type of thing 😉
If you are more of an amateur like me, you probably need to ask one of your colleagues to do it… But they never have enough time or simply don’t make it look good enough!
My boss doesn’t like to look at a standard spreadsheet anymore. He expects something presentation ready! ‘High impact or head home’ is his mantra. Plus he comes up with so many new questions every week —
Can you show me how many sales we had last week?
Can you compare that with the week before…
How about last year?
Is there a trend going up or down there…
**face palm**
Our company just implemented a new CRM system that should make things more efficient, but truth-be-told it actually makes things worse! Time spent making reports has skyrocketed!
And working overtime isn’t going to fix things! I want my life back :’(
BTW, I hope you recognize these situations!
Imagine there was an app you set up once and you could get all these answers directly!
No more hassling and haggling for data from the BI guys. No more excel madness, no more. Photoshop to make reports look good! Just an Awesome Spreadsheet Dashboard!
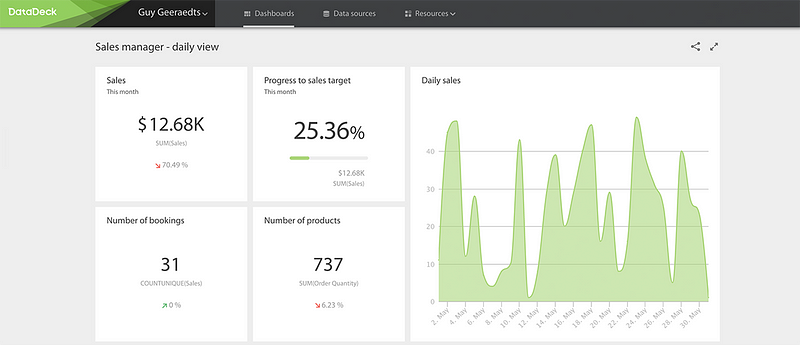
Now there is! It’s called Spreadsheet Dashboards from Datadeck! And the best thing is, it’s free!
Connect all of your spreadsheets (Excel, CSV and Google Spreadsheets) in one place and merge all the data together in one (or many) beautiful dashboards.
Datadeck’s dashboards are set and forget. Build it once and it automatically updates as you change the data in the spreadsheet.
Need to make a quick change to please the boss? No worries! Change the date range or add more widgets even connect some other data sources that aren’t a spreadsheet ….
And voila! In an instant, it’s ready. Just how your boss likes it 🙂
We just got featured with Spreadsheet Dashboards from Datadeck on Product Hunt
We’d love your support!

